Susana García (ISQCH/CSIC/UNIZAR) — Compiling a database of nonlinear optical properties using high-level computational chemistry methods
Don't miss any Success Story following us on X and LinkedIn!
@RES_HPC RES - Red Española de Supercomputación @res-icts.bsky.social
Check this Success Story at our LinkedIn: Compiling a database of nonlinear optical properties using high-level computational chemistry methods
💡A RES success story about compiling a database of nonlinear optical properties💡
📋"Compiling a database of nonlinear optical properties using high-level computational chemistry methods" developed by Susana García Abellán and Juan Vicente Alegre from ISQCH - Instituto de Síntesis Química y Catálisis Homogénea (CSIC- UNIZAR), in collaboration with Josep Maria Luis Luis from Universitat de Girona
Nonlinear optical properties (NLOP) are key to understand how molecules respond to electromagnetic fields and are key in technological applications in telecommunications and biomedicine. These properties include dipole moments (μ), polarizabilities (α), and 1st & 2nd hyperpolarizabilities (β, γ), and are really sensitive to the electronic structure and molecular features
🖥️ Thanks to RES supercomputer Agustina at Instituto de Biocomputacion y Fisica de Sistemas Complejos - BIFI, the team generated molecular and atomic descriptors for an initial database of 2 000 small organic molecules.
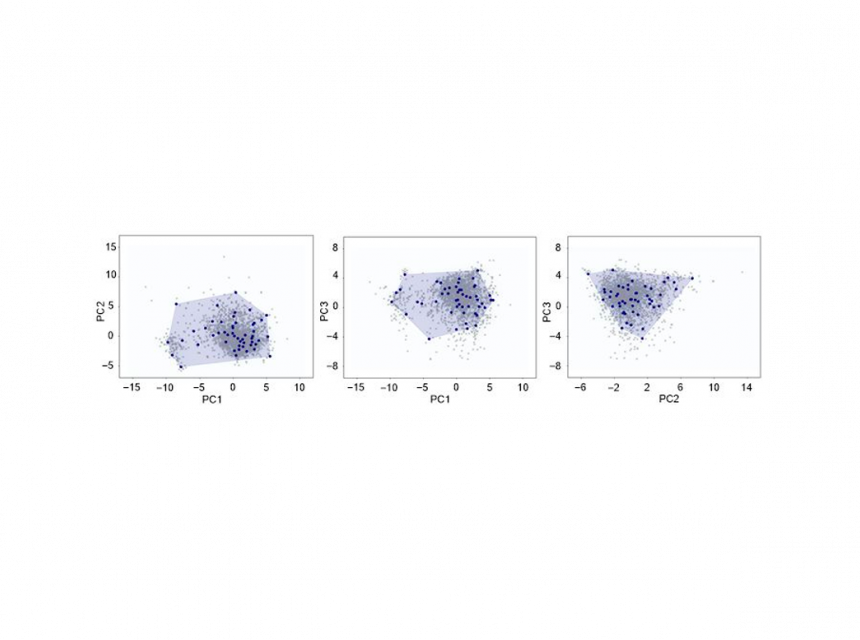
They chose 50 representative structures through chemical-space clustering (selection shown in the image, after PCA-based dimensionality reduction) and then computed their optical properties. Finally, they launched an active-learning cycle to train a predictive model with these high-precision data and are now refining the model's accuracy.
This project aims to generate high-quality reference data to train machine-learning models that not only predict NLOP behaviour accurately, but also offer insight into the structural factors that govern optical responses.
📷 The image shows 2D chemical space representations of the clustering coverage, visualized via PCA projections for the initial 2000 molecule dataset. Molecules selected within the clusters are shown as blue dots and are connected by lines to outline the covered region. Nonselected compounds are shown as grey crosses. The first three principal components captured a substantial portion of the total variance. (81.8 %. PC1 47.6 %, PC2 23.5 %, PC3 10.7 %)


